
For Students, Residents, Departments, and Institutions
Your statistics, start to finish, on your own machine.
MedResearch Suite picks the right statistical test, runs it, checks the assumptions, and draws the figure your journal expects. Every number is validated against R, and the whole engine runs locally, so your dataset never goes online.
Free. No account, no sign up.
statistics cross-checked against R
workspaces, question to manuscript
HIPAA identifiers the scanner knows
bytes of your data ever transmitted
It picks the right test
Mark which column is which. The app runs Shapiro-Wilk normality and Levene variance checks, selects the correct test, and tells you why in plain English. When your data breaks an assumption it offers the proper alternative, such as Welch, Firth, or McNemar, instead of quietly handing you the wrong number.
It never leaves your device
No cloud, no account, no upload. The analysis engine runs on your own computer, and the app works with the network cable pulled out. Patient data has nowhere to go because there is nowhere to send it.
It agrees with R
Every test in the analysis menu is cross checked against R's gold standard packages, from metafor to survival to pwr. Not approximations of them. The same numbers, to displayed precision.
01 Real screens, real numbers
See it in use.
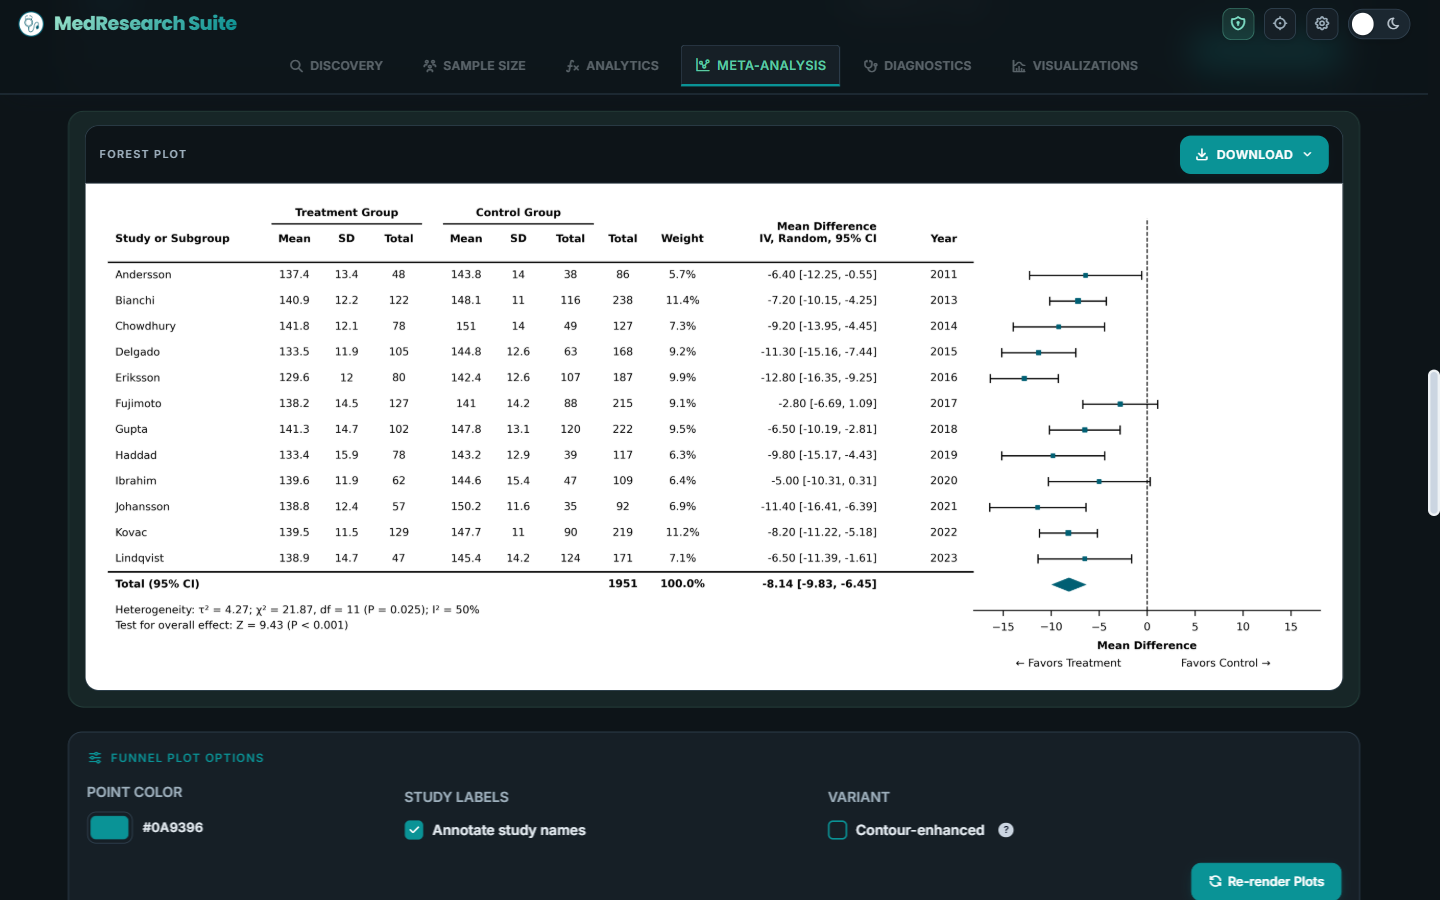
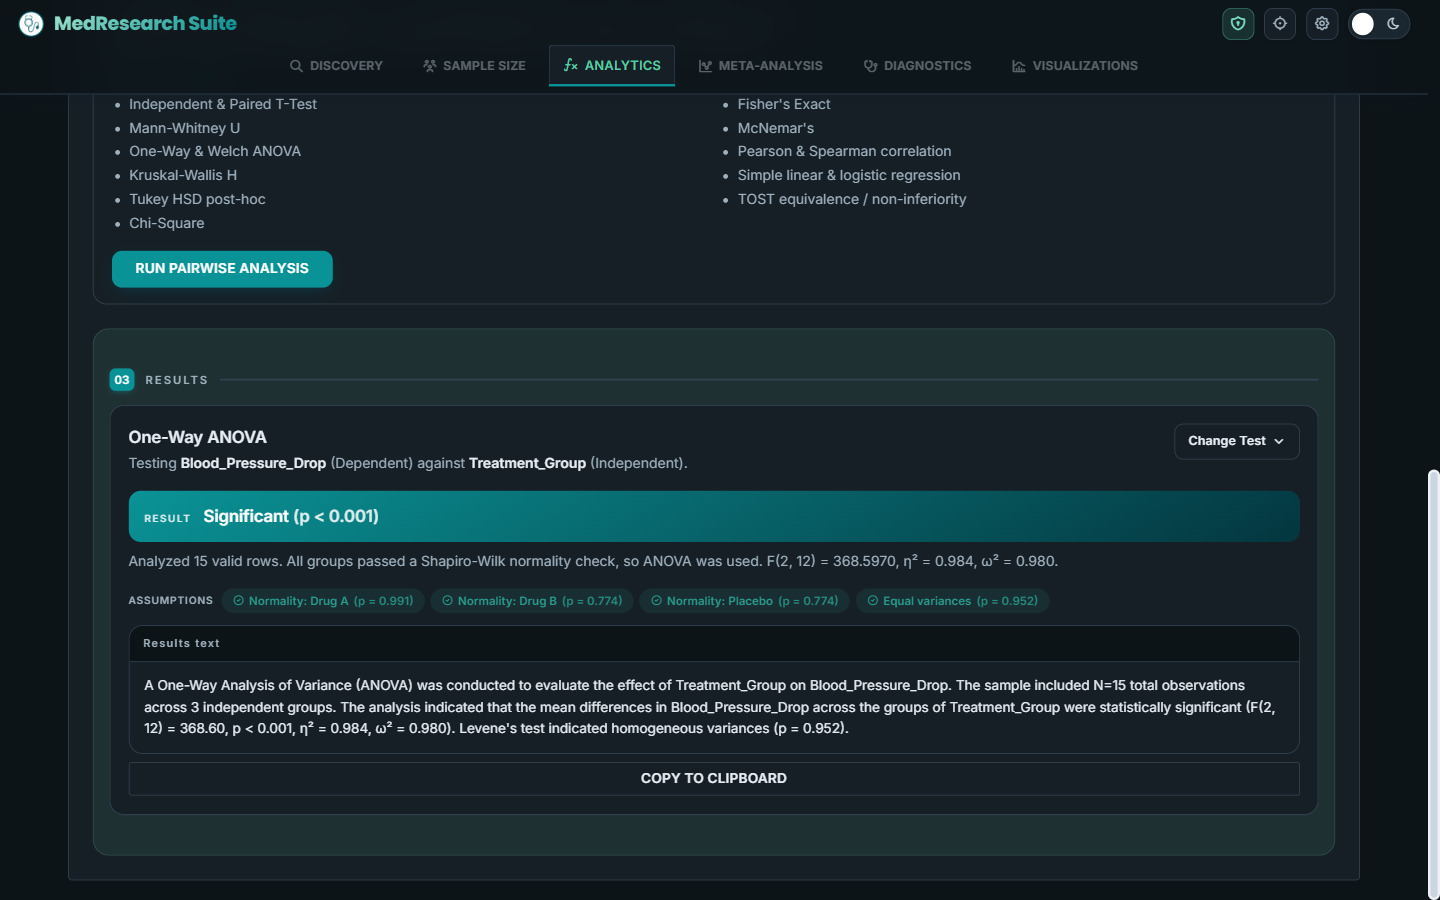
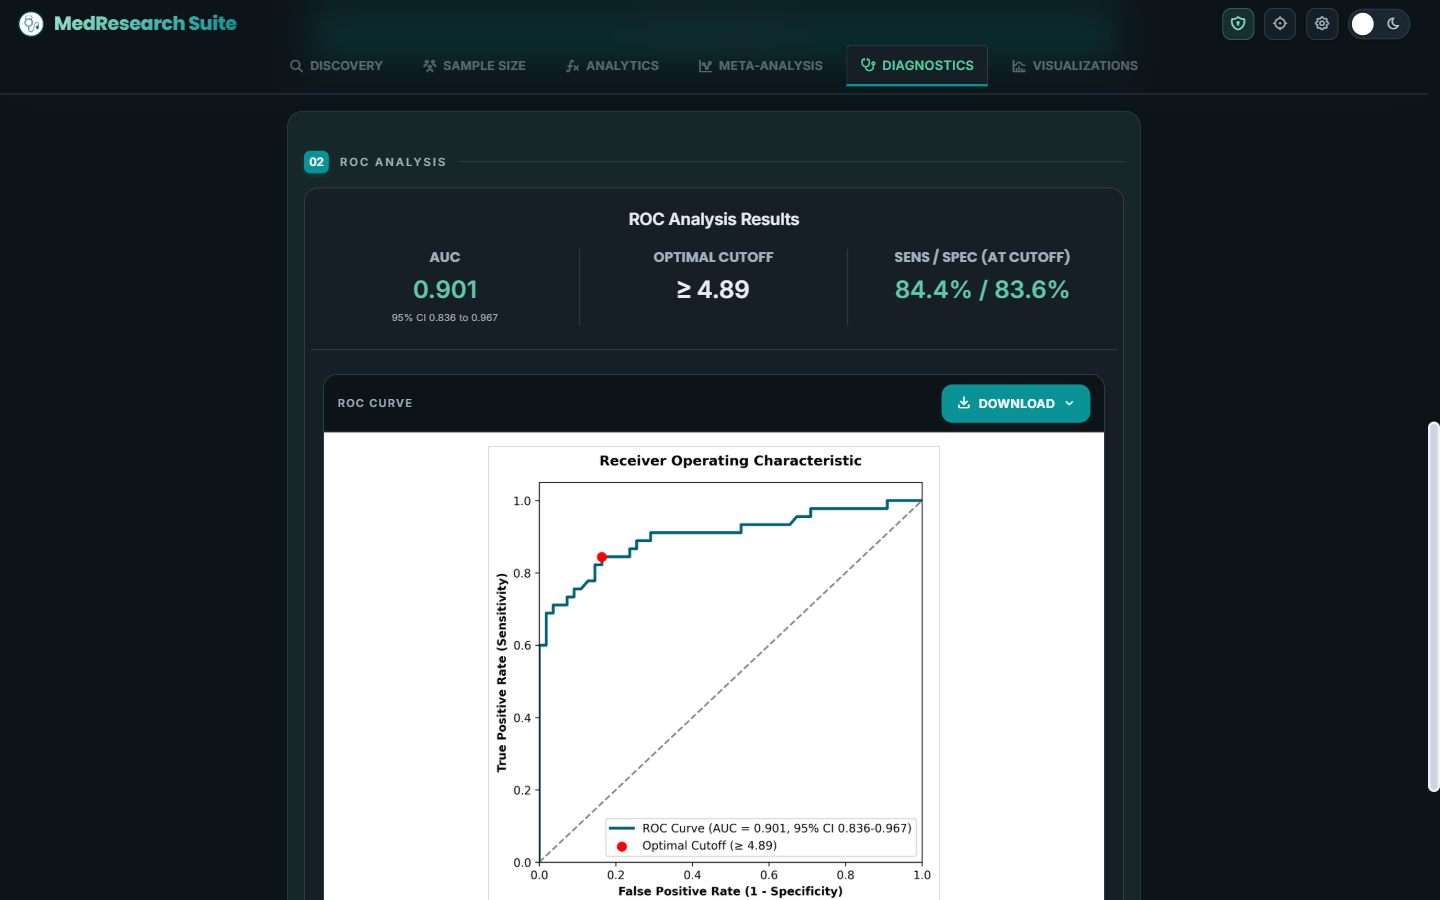
These are not mockups. Every screen below is the app running on real data, captured live, with the result it actually produced.
02 The rule, in your hands
Which test would it choose?
This is the decision the app makes the moment you mark your columns, and it is the one most projects get wrong. Tell it what your data looks like and watch it choose. Nothing to download.
Welch's t-test
This is where the app starts, not where it stops. Every default above was picked by simulation rather than by habit, and the pattern is the same each time: where the textbook choice depends on an assumption that is easy to break, the app takes the one that does not. That is why a Welch test is the default even when the variances agree, and why the non-normal answers are Brunner-Munzel and the ANOVA-type statistic rather than Mann-Whitney and Kruskal-Wallis, which quietly need the groups to share a shape. The familiar tests are all still there when you want them. The app checks the assumptions on your actual data and shows its reasoning, which is the part a flowchart cannot do for you.
03 One tool, whole project
From question to manuscript.
Most projects lose weeks moving between a spreadsheet, a stats package, and a drawing tool. This is all four stages in one place.
Discovery
Measure what already exists. Search PubMed for the published footprint and ClinicalTrials.gov for the trials already under way, before you commit a year to it.
Sample Size
Power the study properly before you collect. t tests, ANOVA, proportions, and correlations, including unequal allocation.
Analyze
Mark your columns. The right test is selected, the assumptions are checked, and the effect size and confidence interval come with the p value.
Publish
Export figures at 300 DPI in PNG, JPG, TIFF, or SVG, with a plain-English write-up ready for the manuscript.
04 Privacy by construction
Patient data never leaves the device.
The one thing a research tool cannot afford to get wrong, settled by how it is built rather than by what it promises.
There is no cloud, no account, and no upload. The analysis engine runs on your own computer and the app works with no internet connection at all. That is not a policy you have to trust. It is simply how the software is built.
A built in Safe Harbor helper can scan a dataset for the eighteen HIPAA identifiers and hand back a de-identified copy, and the app warns you before any free text you type could ever be sent out.
MedResearch Suite is a research tool, not a certification. It does not by itself make a project HIPAA compliant, and it is not a substitute for a statistician or your institution's review process.
05 Six workspaces
What it does.
The same six workspaces you see in the app, in the same order.
Discovery
Measure how much has already been published on your question through PubMed, and how many trials are registered or running through ClinicalTrials.gov, with a study type breakdown.
Sample Size
Power analysis for t tests, ANOVA, proportions, and correlations, with unequal allocation and one sided options.
Analytics
Automatic test selection with assumption checks, effect sizes, multivariable models, survival, and reliability.
Meta-Analysis
Forest, funnel, leave one out, and cumulative plots. Fixed, random, HKSJ and modified HKSJ, prediction intervals, Egger, and Begg.
Diagnostics
2x2 tables, ROC and AUC, likelihood ratios, predictive values, kappa, and a Bayesian probability revision plot.
Visualizations
Box, violin, raincloud, Bland-Altman, Q-Q, heatmaps, and PRISMA, CONSORT, and STROBE diagrams.
06 Open the drawers
Validated against R.
Ease of use is worthless if the numbers are wrong. Every test in the analysis menu has been run against R's gold standard packages on the same data and compared to displayed precision. Here is exactly what was checked against what. The reference set is base R's stats together with afex, brunnermunzel, car, epiR, FSA, irr, lawstat, logistf, MASS, MBESS, metafor, nnet, pROC, psych, pwr, rankFD, rstatix and survival. Where no R package implements a statistic, the formula is computed directly in R and named as such, never left unchecked.
Group comparisons and post-hoc tests
| Statistic | Checked against |
|---|---|
| Welch and Student t test | t.test, t.test (var.equal) |
| One-sample t test against a reference | t.test (mu) |
| Paired t test | t.test (paired) |
| One-way ANOVA, eta squared, omega squared | aov |
| Welch ANOVA | oneway.test |
| Two-way ANOVA with interaction, Type II | car::Anova |
| ANCOVA, Type II | car::Anova |
| Repeated-measures ANOVA, partial eta squared | afex::aov_ez |
| Mauchly sphericity, Greenhouse-Geisser, Huynh-Feldt | afex::aov_ez, stats::mauchly.test |
| Friedman and Kendall's W | friedman.test |
| Cochran's Q | Cochran formula in R, stats::pchisq |
| Mann-Whitney U, exact and tied | wilcox.test |
| Wilcoxon signed-rank | wilcox.test (paired) |
| Kruskal-Wallis and epsilon squared | kruskal.test |
| Brunner-Munzel, with a permutation p under 30 per group | lawstat::brunner.munzel.test, brunnermunzel |
| ANOVA-type statistic on pseudo-ranks, relative effects | rankFD::rankFD |
| Pairwise Brunner-Munzel, Holm adjusted | brunnermunzel (permutation), p.adjust (holm) |
| Tukey HSD | TukeyHSD |
| Dunn (tie corrected) and Games-Howell | FSA::dunnTest, rstatix::games_howell_test |
| Levene (Brown-Forsythe) variance check | car::leveneTest |
| TOST equivalence | Schuirmann, Welch |
Regression and correlation
| Statistic | Checked against |
|---|---|
| Pearson correlation with CI, and Spearman's rho | cor.test |
| Spearman exact permutation p (n of 9 or fewer, no ties) | cor.test (exact), full enumeration |
| Kendall's tau-b, tie corrected | cor.test (kendall) |
| Linear regression, slope CI, adjusted R squared | lm, confint |
| Binary logistic with profile likelihood CI | glm, confint.glm |
| Firth penalized logistic (separation) | logistf |
| Ordinal logistic | MASS::polr |
| Poisson and rate models with offset | glm (poisson) |
| Negative binomial, alpha and profile CI | MASS::glm.nb |
| Multinomial logistic | nnet::multinom |
| Multivariable linear and logistic | lm, glm |
Categorical and exact tests
| Statistic | Checked against |
|---|---|
| Chi-square with Yates correction, Cramer's V | chisq.test |
| Fisher exact, conditional OR and exact CI | fisher.test |
| Fisher-Freeman-Halton (larger tables) | fisher.test |
| McNemar, exact binomial and corrected | mcnemar.test, binom.test |
| Cochran-Armitage trend | prop.trend.test |
| Holm and Benjamini-Hochberg correction | p.adjust |
Meta-analysis
| Statistic | Checked against |
|---|---|
| DerSimonian-Laird pooled estimate and CI | metafor::rma (DL) |
| Hartung-Knapp-Sidik-Jonkman | metafor::rma (knha) |
| Modified Hartung-Knapp-Sidik-Jonkman | metafor::rma (adhoc) |
| Prediction interval (IntHout t, k-2 df) | metafor::rma, IntHout 2016 t(k-2) recomputed |
| Begg and Mazumdar rank correlation | metafor::ranktest |
| Egger regression | metafor::regtest |
| Diagnostic meta-analysis, pooled Se and Sp | metafor (PLO, DL) |
Survival and diagnostics
| Statistic | Checked against |
|---|---|
| Kaplan-Meier medians and log rank | survival::survfit, survival::survdiff |
| Cox proportional hazards, HR and C-index | survival::coxph |
| Competing risks, Aalen-Johansen CIF | survival::survfit (multi-state) |
| Clopper-Pearson exact proportion CI | binom.test |
| Likelihood ratio and DOR intervals | epiR::epi.tests |
| ROC AUC and DeLong interval | pROC::roc, pROC::ci.auc |
Reliability, effect sizes, and power
| Statistic | Checked against |
|---|---|
| All six ICC forms with F based CIs | psych::ICC |
| Fleiss kappa | irr::kappam.fleiss |
| Hedges' g with noncentral t CI | MBESS::ci.smd |
| Hedges' g for paired differences, with noncentral t CI | noncentral t, independently recomputed |
| Correlation sample size | pwr::pwr.r.test |
| Unequal allocation t test sample size | pwr::pwr.t2n.test |
What the app refuses to do, and where it is stricter than R
Agreeing with R is only half of being right. The other half is declining to answer when the data cannot support the question. Every condition below is detected, explained in words, and covered by its own automated check. R's behaviour on the same data was established by feeding it the same defective datasets, and it is recorded because on this class of problem R is often the weaker party, not the target.
| The data | What this app does | What R 4.6.0 does |
|---|---|---|
| Every group holds one repeated value, so there is no spread to measure a difference against | Declines, and names the rank test that still answers | Reports a result. On twelve identical values aov gives F = 1, p = 0.405, and
TukeyHSD gives an adjusted p of 0.047, a significant difference between identical
groups, decided by rounding error |
| A correlation from two points | Declines: two points always fall on a line, so the coefficient is 1 whatever the values are | Declines |
| A meta-analysis of a single study | Declines | Reports a pooled effect and a p-value |
| A study whose estimate has no confidence interval | Declines, naming the study | Silently drops that study from the pooled effect, warning only that a study had missing values, so the answer is to a different question |
| A survival time that is negative, or an event code it does not recognise | Declines, naming the column | Accepts the negative duration; converts the unrecognised code to missing and drops that subject from the curve |
| A power calculation asking for power of exactly 1 | Declines: it is not attainable with a finite sample | Returns a required sample size of one billion |
| Perfect separation in a logistic regression | Detects it exactly, by the linear program that decides whether the estimate exists, and offers Firth's penalized regression with profile-likelihood intervals | Reports odds ratios with standard errors in the tens of thousands and p near 1, which is the Wald test breaking down rather than evidence of no effect |
| A 2x2 table with an expected count below 5 | Switches to Fisher's exact test and says so | Runs the chi-square and warns that the approximation may be incorrect |
Two comparisons are meaningless unless the exact R call is named, and both are named in the harness:
cor.test for Spearman on tied data underflows to exactly zero unless asked for the
asymptotic form, and psych::ICC defaults to a mixed model that returns a different
estimator from the classical one this app implements.
The limits of agreement on a Bland-Altman plot carry an exact confidence interval, from the non-central t distribution, rather than Bland and Altman's 1999 approximation. A coverage simulation against a known population limit, 40,000 samples at each size, puts the approximation at 92.2% at five pairs and 92.7% at eight, where the exact interval holds 95.0% at every size from five to a hundred. Carkeet (2015) reports the same permissiveness below about forty pairs. The approximation is still computed and returned, so a figure made before this change can be reconciled.
07 Who it is for
Built for the people doing the work.
Students and residents
Your first project, without a statistician on speed dial. The test is chosen for you, the assumptions are checked for you, and the write-up is ready to paste.
Departments
Give a whole team a research tool that produces publishable figures, teaches the right test as it goes, and does not create a data governance problem.
Institutions
A portable build runs without admin rights on locked down machines, and nothing anyone analyzes is ever transmitted anywhere.
08 Straight answers
Questions.
How much does it cost?
It is free. No account, no sign up, and no licence key.
Does my patient data leave my computer?
No. There is no cloud, no account, and no upload. The statistics engine runs on your own machine, and the app works with no internet connection. Your dataset is held in memory while you work and is never written to a server, because there is no server to write to.
Is it HIPAA compliant?
That question does not really apply to a tool, and anyone who answers it with a simple yes is overselling. Compliance is a property of your project and your institution, not of software. What the app does is keep the data on your device, ship a Safe Harbor helper that scans for the eighteen identifiers and returns a de-identified copy, and warn you before any free text you type could be sent out. What it does not do is make your study compliant on its own.
Can I install it on a locked down hospital computer?
Yes. Alongside the normal installer there is a portable build. You extract it to any folder you can write to, such as your desktop or a USB stick, and run it. No installation, no administrator rights, no registry changes, and nothing left behind afterwards.
Does it work offline?
Yes, completely, for every analysis. The only features that need the internet are the ones that are about the internet: the literature search in Discovery, which queries PubMed and ClinicalTrials.gov, and the optional AI topic suggestions. Your data is not part of either.
How do I know the numbers are right?
Every test in the analysis menu has been checked against R's gold standard packages on the same data, and matches to the precision it displays. The full list is in the section above. An automated harness re-runs 472 checks, 252 of them comparisons against stored values from R's own packages, and it has to pass before any release, so a change cannot silently break a result. The comparisons are in the repository, so you can run them yourself rather than take our word for it.
Does this replace a statistician?
No, and it does not try to. It removes the mechanical errors, choosing the wrong test, missing an assumption, reporting a p value with no effect size, and it explains what it did in plain English. Study design, confounding, and interpretation still need a human, and anything headed for publication deserves a proper review.
What happens if my data breaks an assumption?
You are told, and you are offered the correct alternative. If variances are unequal it suggests Welch. If a logistic model is perfectly separated it suggests Firth's penalized regression rather than reporting an absurd odds ratio. If your groups are not normal it moves to the nonparametric equivalent. The reasoning is shown, so you can learn the rule rather than just take the output.
What can I export?
Figures export at 300 DPI in PNG, JPG, and TIFF, and as true vector SVG, which is what most journals ask for. Every result also has a plain-English write-up with the effect size and confidence interval, which you can copy to the clipboard and paste into a manuscript.
What data formats can I load?
CSV and Excel files, or you can type and paste directly into the data grid. Meta-analysis and diagnostics have downloadable templates so the column layout is unambiguous, and the importer maps your columns for you.
Which operating systems are supported?
Windows 10 and 11 today, as a 247 MB installer or a 308 MB portable build. A macOS version is in preparation and will be signed and notarized by Apple so it opens without warnings.
Does it use AI, and does that see my data?
There is one optional AI feature that suggests novel research angles, and it is off unless you add your own API key. It only ever receives the search wording you type, never your dataset. Before any text leaves the device, a guard scans it for patient identifiers and blocks it by default until you confirm twice.
Who made it, and can I get it for my department?
MedResearch Suite is built by HariOm S. Vaja. If you would like it running across a department or an institution, including on machines that block installers, get in touch.
09 Get in touch
Bring it to your department.
Rolling it out across a department or an institution, getting it onto machines that block installers, or telling me it got something wrong. All of it reaches the same inbox, and it is read by the person who wrote the software.
- How many people, and whether the machines block installers
- The analysis you are stuck on, and what you expected instead
- For a bug, the exact numbers on screen and what you clicked